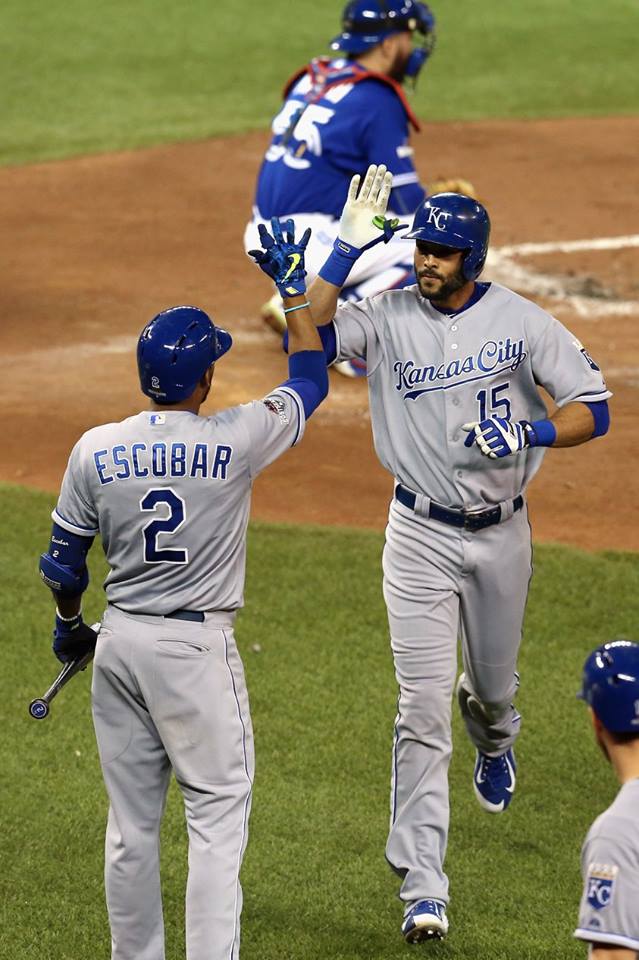
Alex Rios high-fives Alcides Escobar in Game 4 of the ALCS (Source: Royals Official Facebook)
At KC Digital Drive, we’re big believers in the smart use of data. Locally, we’re not alone. The City of Kansas Cty, Mo. and the Unified Government of Wyandotte County/Kansas City, Kan. have open data portals that allow city leaders and citizens to gain deeper insight about how the city functions, where the money’s going, and what could work better.
The Kansas City Royals are also believers in good use of data. ESPN even called them a “Believer” in the magazine’s Great Analytics Rankings report earlier this year.
If you’ve seen the movie (or read the book) Moneyball, you probably have a sense of how data analytics and the practice known as sabermetrics are influencing how the game is played. Just as on-air commentators spew statistics for every conceivable combination of actions on the field both present and past, smart data scientists are hard at work inside the teams’ front offices, crunching numbers to try to predict futures.
So, as our boys in blue roll their way to their second consecutive World Series (woohoo!), we caught up with one such number cruncher: Daniel Mack is the Royals’ Director of Baseball Analytics, Research Science. An experienced analyst with expertise in data mining and machine learning, Mr. Mack was kind enough to participate in the below Q&A while traveling with the team to Toronto this past weekend.
KC Digital Drive: What do you do, in a nutshell?
Daniel Mack: To begin with, it’s probably helpful to describe our department in baseball operations. Our department is called Baseball Analytics. We are a team of 6 (Mike Groopman is the Director of Baseball Operations, Analytics, John Williams is the Director of Baseball Analytics, Player Personnel, Guy Stevens is the Assistant to Baseball Analytics, Harper Weaver is our Systems Architect, and Michael Cifuentes is the Analytics Intern). Our mission is to interact with the data streams and information collected from our sport and help curate, create, and facilitate using that data to help with decision making across all levels of the organization, from Pro Scouting, to Player Development, to Amateur Scouting.
My role as the Director of Baseball Analytics, Research Science is to help oversee the department with Mike Groopman and John Williams, and utilize my background in machine learning and data mining to help build a number of our long term projects and models which we use to make suggestions across those levels I listed above.
How did you end up doing this for the Royals? Were you always a stats junkie?
I was fortunate enough to be hired as a baseball analytics analyst at the beginning of the 2013 season. My background is fueled by my passion for finding and understanding the signal in all sorts of data, and baseball has no shortage of signals to explore.
This year’s Baseball Prospectus PECOTA projections famously predicted the Royals would only win 72, and we blew past that. What do you think is the bigger lesson we can take from that discrepancy?
Projection and forecast systems are tools to help identify baseline talent and make some general guesses as to how that talent will evolve. This means they are at the mercy of a number of small factors which to most systems appear as noise or just defined as variance. This variance is often high enough that it’s hard to know if the model is inherently wrong or if was too simple in its forecast. The key takeaway isn’t to be happy that we exceeded the projection, but to understand what/if any of those smaller factors can explain the difference, and are general enough to keep relying on in the future, which should allow us to exceed projections.
Managing a baseball team isn’t all about data. It’s also about making calls from the heart and the gut. What’s it like being on one side of that equation and working to strike a balance with the other?
This question is interesting in the context of the PECOTA question. Baseball is a game of percentages and as such, the “gut feel” that people in the game rely on, is in their mind a method to separate two choices that seem nearly identical in their general likelihood of success. Because of the variance in those possible outcomes, it’s hard sometimes to know if that original decision was the right one. A component of our department’s job is to make sure we aren’t grouping all the choices together equally, if there are simply better choices than others on the table. We are also tasked with explaining this to people who are equipped to execute those choices. If you can help remove a couple of bad choices to begin with, you make “gut feel” decisions more likely to succeed.
Biometric sensors and IoT devices are infiltrating sports, tracking everything it seems. How does that make your job easier or harder?
Baseball is trending towards collecting data that is often high dimensional, and high frequency. This presents a number of challenges in terms of efficient storage and allowing for both targeted retrieval for more rapid fire studies, as well as giving us an opportunity to collect and build more involved models to help identify traits we want in our players.
What’s your most exciting ‘data moment’ you’ve had?
My most exciting moment probably occurred when I was still in graduate school. I was working on flight diagnostic algorithms, and was able to see how my models could actually indicate component failures in a number of flights before accidents actually occurred. Seeing my work have a practical application that can make lives safer was incredibly cool.
Since we at KCDD have an interest in how the city government uses public data to make the city’s services work more efficiently, what lessons could the city manager learn from sports data analysis?
I think that if there is any lesson to be learned, it’s that we live at a time when there is enough data and enough people interested in the data, that one-off investigations aren’t always the best use of an analyst’s time. I feel that much like any engineering path, we should be looking to data scientists, applied mathematicians and statisticians to start building larger more complex projects and models for civic uses. These projects may not bear much fruit in the short term, but instead can adapt as cities grow and shrink with the rest of the county, state, country, etc. This can help improve efficiency, and hopefully allow for responsible growth with some ability to forecast and project to reality.